Analyzing Temperatures at Locations on Mars
This web application takes in a location on Mars as input, and provides known ground surface temperature data recorded in that region, albeit at specific times of day. This information could be used to compare against JMARS' KRC surface temperature prediction tool with the ultimate goal to be able to accurately model thermal extremes for future missions. This dataset comes from the Mars Reconnaissance Orbiter which is currently orbiting the planet. To learn more about how the data is retrieved and processed, see the about page.
Select Location and Time of Day
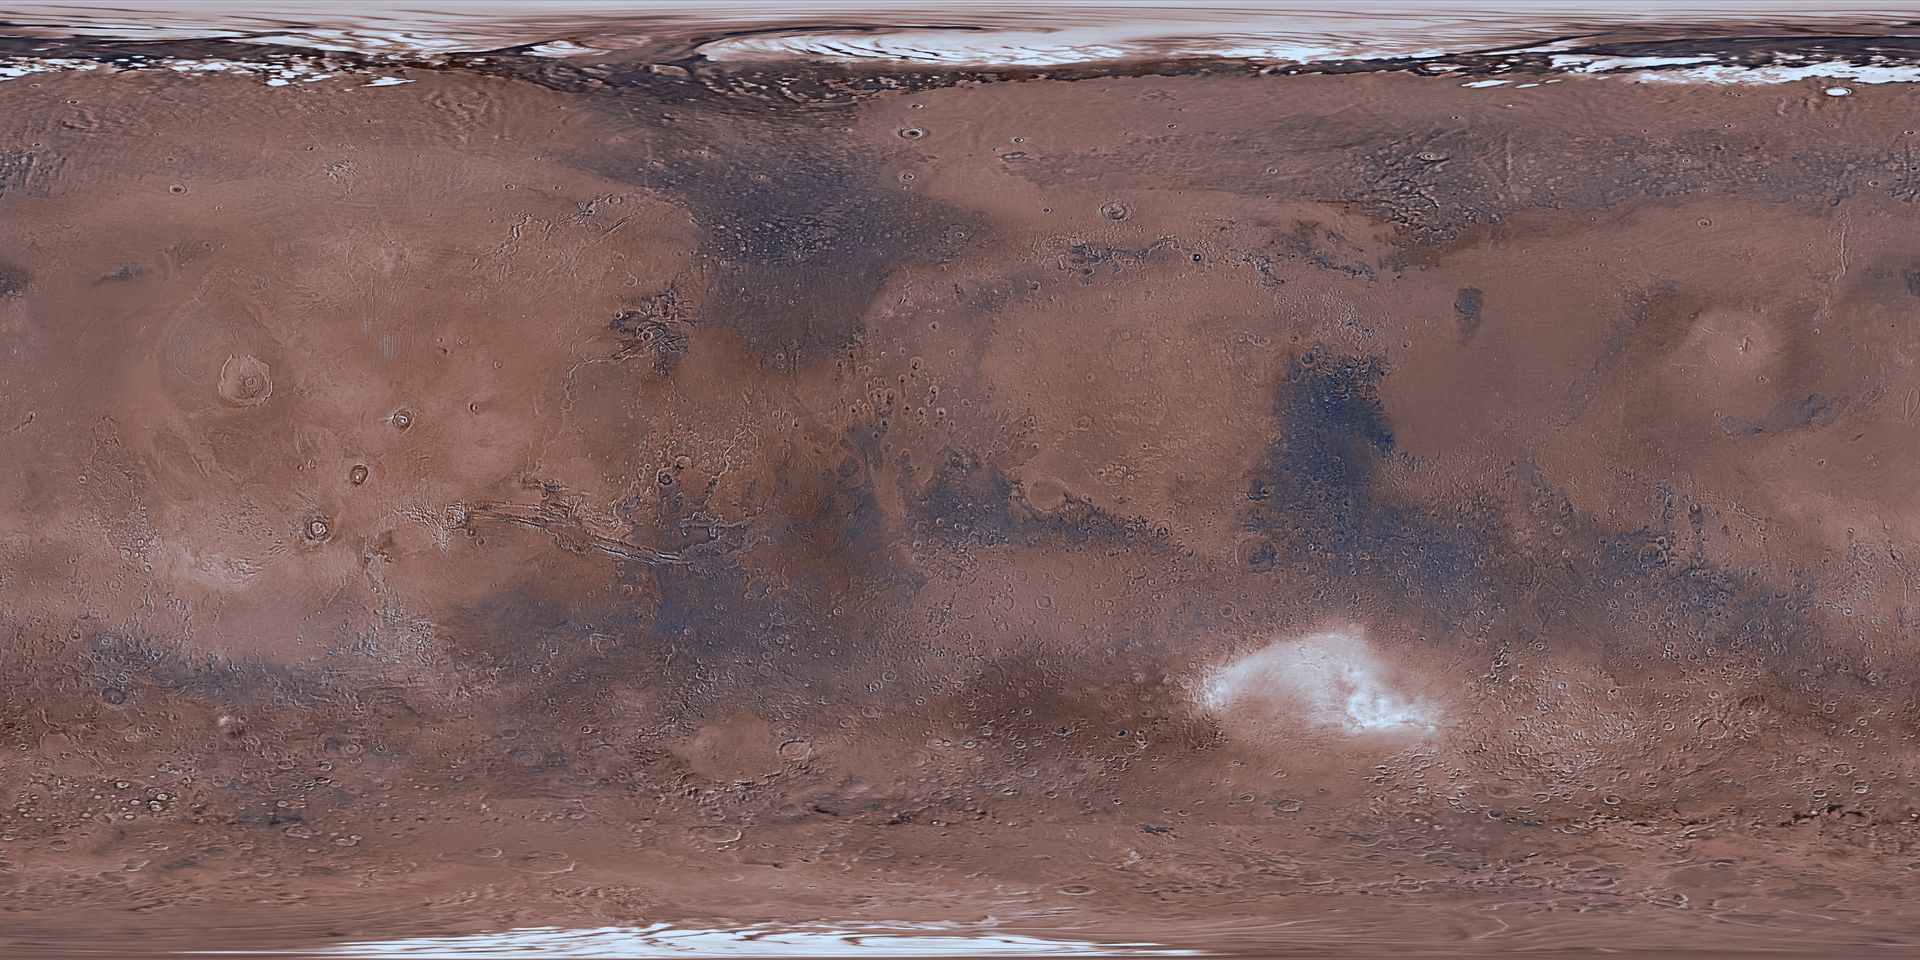
Please select the range of latitudes and longitudes you'd like to analyze. See the equirectangular projection map of Mars for the selected region of interest. To keep loading times faster, select smaller regions. Currently, this site is limiting the range to 20° in either direction due to processing time.
Latitudes and Longitudes
Degrees of latitude range from -90° (South Pole) to 90° (North Pole), and span approximately 59 km (Mars_radius*pi/180 degrees per semicircle).
Degrees of longitude range from -180° to 180° according to the prime meridian set at Airy-0 crater, and span approximately 59 km only at the equator, since it depends on latitude. You may need to subtract 360° from longitudes seen between 180 and 360° on the web (wikipedia)
How to Use this Application
Begin by selecting a range of latitude and longitude you'd like to analyze.
Visualizing Selected Region

Table of Data

Here are all the data entries within the region selected, inclusive of the end conditions. To download the data for analyzing yourself, use the button below to copy the data and you can simply paste it into Microsoft Excel.
| Date and Time UTC | Latitude | Longitude | Temp. [K] | Local True Solar Time |
|---|
Copy Table to Clipboard total 0 data entries
Plot of Data
See the plot of temperature vs time for the selected region and time of day
This chart visualizes the ground surface temperature measurements taken by the Mars Reconnaissance Orbiter over time. Click and drag to zoom, and shift drag to slide. Use the button in the top right to make fullscreen, print, or download a csv file.
Statistics
While many of the plots that result seem sinusoidal in nature (due to the seasons on Mars), the predictive capability of curve-fitting simple sinusoids in this manner might lead to misrepresentations. Particularly, you can look at how this sinusoidal shape diverges as one nears the poles or even the equator. The viewer is left to interpret this difficult-to-capture variation, and use or model it as they see fit.
Note that Maximum, Minimum, and Average values reported ARE NOT representative of true values even if the entire range of Local True Solar Time is selected (minimum temps should correspond with nighttime, and maximum during daytime) because the spacecraft is following a sun-synchronous orbit (source): only collecting data corresponding to the same time each martian day. The datapoints collected are not independent random samples across the planet, and therefore, patterns may emerge if the viewer restricts certain times of day or locations. Put succinctly, the spacecraft doesn't collect data during the hottest or coldest times of day hence why JMARS is recommended. Use these results at your own risk.
Maximum Value
The maximum temperature found within the selected region is [] K (or -273.150 °C)
Minimum Value
The minimum temperature found within the selected region is [] K (or -273.150 °C
Average Value
The average or mean temperature for the selected region is [] K (or -273.150 °C)